Reporting sat apart from ERPNext
Figures reached Salesforce through a monthly entry, so reports showed what had been loaded rather than what ERPNext held.

Every month, the BestinBrands team entered its figures into Salesforce, and the comparisons came back on their own: this month against last, this year against the year before. That part worked. The reports that had to pull from more than one system were a different story.
Reporting already worked. Comparisons ran on their own.
BestinBrands distributes and markets international brands across several consumer categories in Bangladesh. Each month the team entered its figures into Salesforce, BestinBrands’ own platform, and month-over-month and year-over-year comparisons were produced automatically. Reports went out every month.
The comparisons were automatic. The cross-system reports were not, and the most complex of them took three to four days to prepare.

The gap was not capability. It was distance from ERPNext.
ERPNext held the operational data. The reporting that worked lived in a separate platform, fed monthly, and the reports that crossed several systems were assembled in spreadsheets. BestinBrands was not ineffective. It was spending real days on work a pipeline could carry.
Figures reached Salesforce through a monthly entry, so reports showed what had been loaded rather than what ERPNext held.
Anything combining ERPNext, MariaDB and other systems was exported, cleaned and reconciled in Excel. The most complex took three to four days.
Accuracy matters most to BestinBrands. Each time figures are re-entered or copied, a small mistake can slip through unnoticed.
As the portfolio grew, past periods had to stay available for comparison without slowing every refresh.
We kept what worked and moved it onto ERPNext.
ERPNext stays the system of record. We built a reporting layer that reads from it directly, carries the comparisons BestinBrands already relied on, and brings the cross-system reports into the same model. Automation handles the repetitive assembly. The final check before numbers go out is still a person’s call.

Layer 01Read from the source
A permanent route from ERPNext, MariaDB and other systems into Power BI, through an on-premises gateway. Reports read the system the business runs on, not figures entered somewhere else.
Layer 02Write the rules once
Cleaning, standardising, business calculations and period comparisons live in one shared model.
A definition changes in one place, and all 124 reports follow it.
Layer 03Refresh on a schedule
Scheduled refreshes update the data on their own. Incremental loading processes only what changed, and archived history stays available for trend analysis without slowing every run.
Layer 04Keep it running
A two-node gateway cluster with a fallback node means reporting does not depend on one machine staying healthy.
Five stages, none of which need a person to start them. A person still reviews the result.
Does your ERP hold numbers your reports never see?
Send us the report that takes your team the longest. We will show you what it takes to build it once.
One model underneath. Nine ways to look at the business.
Different teams need different cuts of the same numbers, so we built specialised views on one shared model rather than one dashboard trying to serve everyone. The comparisons BestinBrands already used now sit beside everything else.
Three to four days became about one.
The comparisons BestinBrands relied on stayed. What changed was everything around them: the numbers now come from one place, and the report that used to take days of preparation arrives ready for a person to check.
Most companies already have reporting. The question is how far it sits from the system they run on.
Your reports live outside your ERP
If figures are re-entered into another tool each month, every report depends on that step being done, and done right.
Some reports still need a spreadsheet
When the reports that cross systems are assembled by hand, they are the ones that take days.
One person knows how the report works
When the logic lives in someone’s workbook, it leaves when they do.
Closing the distance does not mean throwing away what works. It means reading from ERPNext, writing the rules once, and letting your team spend its time on what the numbers mean.
Invento connects ERPNext to Power BI and builds the reporting layer around how your business already reports, keeping what works and automating what does not.
Talk to us about your reporting or browse our workWhat changed for BestinBrands
Related work and practical guides to help you plan your next step.
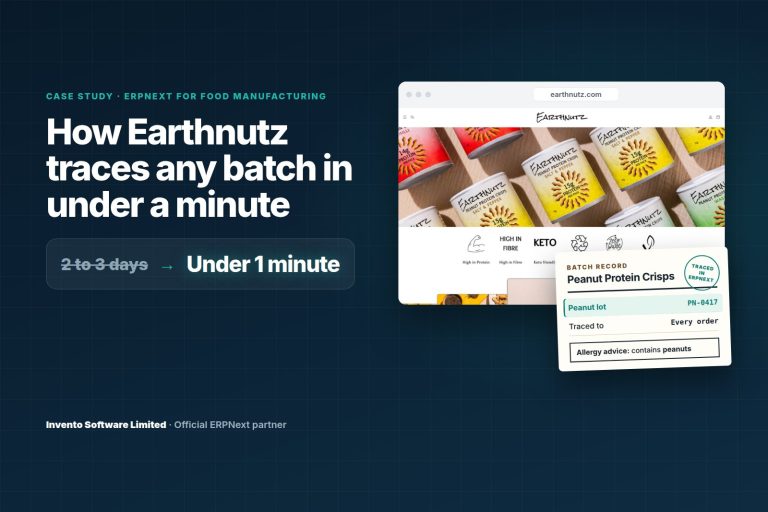 Food manufacturingEarthnutzA food brand born from a family allergy, and the promise it has to keep on every pack.Read the case study
 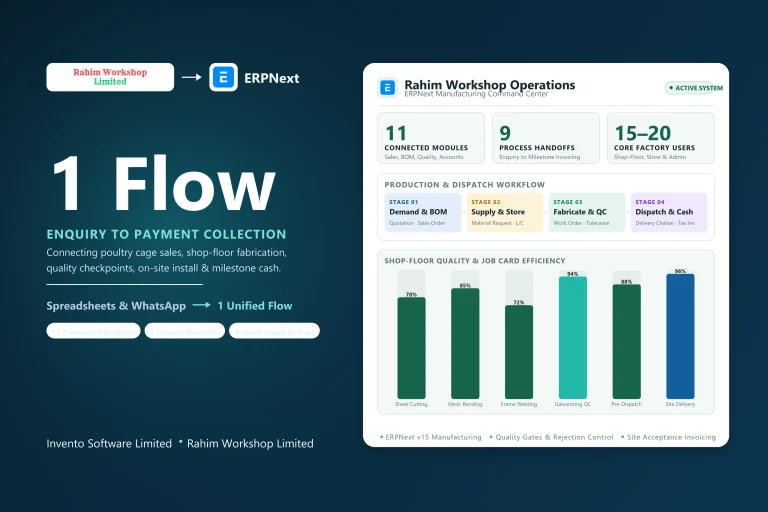 Steel fabricationRahim WorkshopA manufacturing business chose ERPNext. Which handoffs needed to come together?Read the case study
 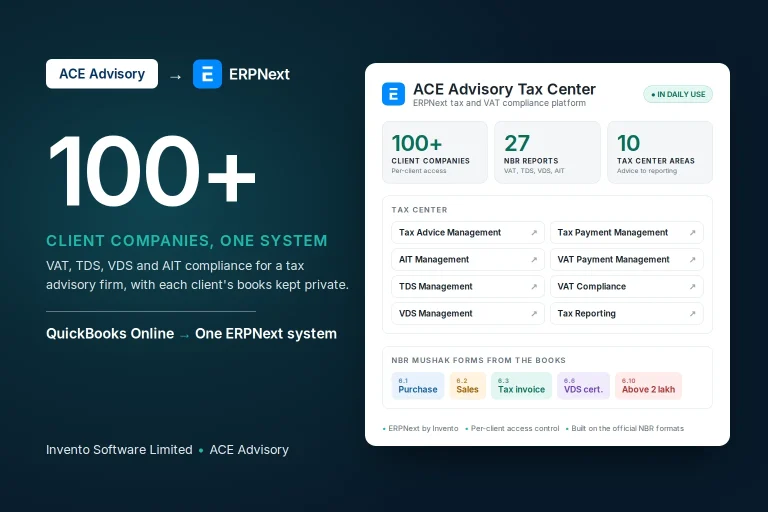 Accounting and complianceACE AdvisoryA tax practice outgrew QuickBooks. Its next system had to handle much more than the books.Read the case study