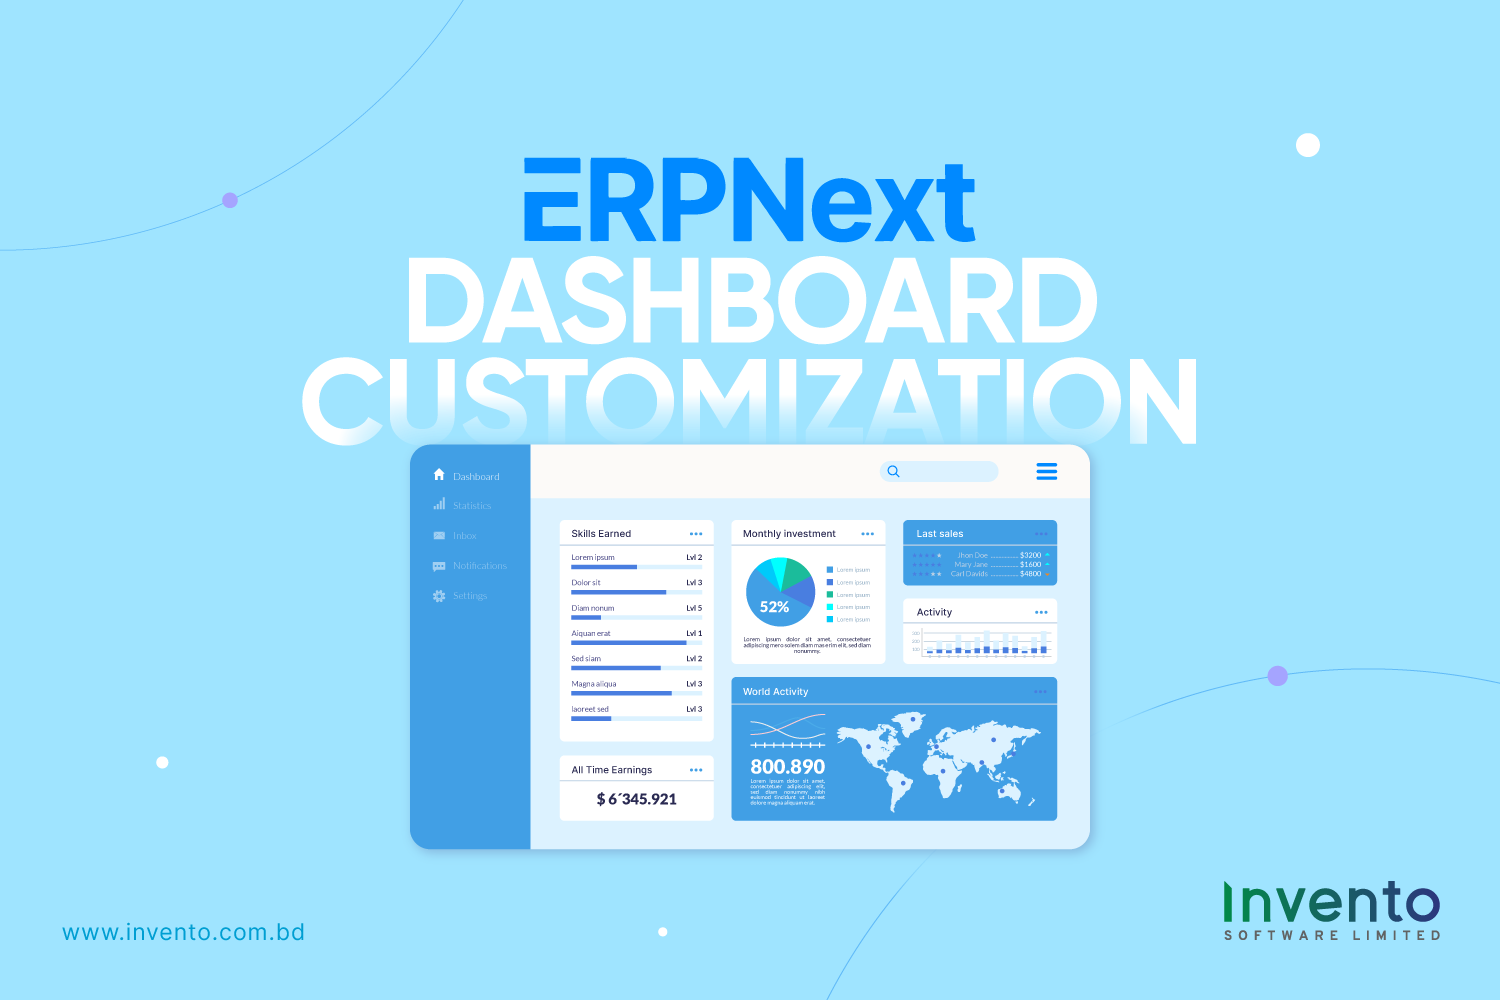
Executive Summary (2026 Developer & Business Guide): In modern enterprise management, an ERP system is only as valuable as the speed at which leadership and operational teams can extract actionable insights. ERPNext dashboard customization—engineered on the flexible, open-source Frappe Framework (v14, v15, and v16)—transforms passive transactional data into high-velocity operational command centers. Rather than forcing executives, warehouse controllers, and retail branch managers to spend hours extracting manual CSV reports and assembling fragile Excel spreadsheets, customized ERPNext dashboards present prioritized Key Performance Indicators (KPIs) through dynamic Number Cards, real-time Dashboard Charts, optimized SQL query analytics, and role-based Frappe Workspaces. As the certified official partner for ERPNext in Bangladesh, Invento Software Limited provides this definitive technical and architectural blueprint to engineering high-performance, role-tailored dashboards that drive instant enterprise decisions.
On This Page: ERPNext Dashboard Customization Guide
- Why Dashboard Customization Is Mission-Critical for Enterprise ERP
- 2026 Master Comparison: ERPNext Dashboard Visualization Elements
- Step-by-Step Technical Guide: Building Custom Dashboards in Frappe
- Production-Grade Role-Based Dashboard Blueprints
- Automated KPI Telemetry: Push Alerts via Email, SMS & WhatsApp
- Enterprise Performance & Database Optimization Best Practices
- Dashboard Governance & Preventing Metric Drift
- Frequently Asked Questions (FAQ)
- Next Step: Partner with Certified ERPNext Engineers
Why Dashboard Customization Is Mission-Critical for Enterprise ERP
Out-of-the-box ERP deployments provide default workspaces and generic chart widgets. However, enterprise workflows are rarely generic. A Chief Financial Officer needs immediate visibility into net cash runway, aging receivables, and Bangladesh NBR tax withholding liability. Conversely, a warehouse supervisor requires real-time alerts on pending delivery dispatches, stockout risks, and batches approaching First-Expired, First-Out (FEFO) expiration. When both personas log into identical, unconfigured dashboards, operational friction multiplies.
In organizations where dashboards are not customized, department leaders waste between 45 and 90 minutes every morning manually pulling tabular reports, exporting CSV files, and constructing ad-hoc pivot tables in Microsoft Excel. Customizing dashboards in ERPNext directly inside the Frappe framework eliminates this latency, turning the ERP into a live operational control tower. To understand foundational setup procedures, review our comprehensive ERPNext step-by-step setup manual, our guide on what is ERP and how does it work, and our deep dive into ERPNext customization techniques.
2026 Master Comparison: ERPNext Dashboard Visualization Elements
The Frappe Framework provides several architectural layers for rendering data visualizations. Understanding the trade-offs between configuration complexity, query performance, and live interactivity is essential when designing enterprise dashboards:
| Visualization Element | DocType / Engine | Technical Complexity | Query & Refresh Speed | Ideal Enterprise Use Case |
|---|---|---|---|---|
| Number Card | Number Card |
No-Code (GUI Builder) | Sub-second (Indexed aggregation) | Single high-priority KPIs: Total Revenue Today, Pending Work Orders, Low Stock Alerts |
| Standard Dashboard Chart | Dashboard Chart |
Low (GUI Builder) | Fast (Time-bucketed caching) | Standard trends over time: Monthly Sales Invoices, Expenses by Account, Order Volume |
| Custom Report Chart | Frappe Query Report / SQL | Medium (SQL & Python) | Medium (Depends on SQL query optimization) | Multi-table joins: Accounts Receivable Aging, Gross Margin % by Item Group, Sales vs Target |
| Custom HTML / JS Widget | Workspace Block (HTML/JS) | High (Front-End JS/CSS) | Instant client-side render | Interactive floor maps, temperature dials, progress gauges, and custom status pills |
| External BI Embed | Iframe (Metabase / Power BI) | High (BI & Data Pipeline) | Offloaded to dedicated BI server | Deep historical analytics across millions of rows without loading production ERP database |
Step-by-Step Technical Guide: Building Custom Dashboards in Frappe
Below is the structured technical process used by Invento’s certified engineers to build responsive, role-based dashboards in ERPNext versions 14 and 15:
Step 1: Configuring High-Impact Number Cards
Number Cards are the most effective way to display critical headline metrics at the top of a workspace. They present a single aggregated value with a percentage trend indicator comparing the current period with the previous period.
How to Configure a Number Card in ERPNext:
- Navigate to the Awesome Bar and search for Number Card List → Click Add Number Card.
- Card Name: Assign a descriptive title, e.g., Today’s POS Gross Revenue (BDT).
- Doctype: Select the source DocType (e.g.,
Sales Invoice). - Function: Choose your aggregation function:
Sum,Count, orAverage. For revenue, selectSum. - Aggregate On Field: Select the numeric field (e.g.,
grand_totalornet_total). - Filters: Apply precise business constraints:
docstatus = 1(Submitted invoices only)posting_date = Today(or dynamic date macro)is_return = 0(Exclude credit notes)
- Percentage Change Metric: Enable “Show Percentage Stats”, set the comparison window to Daily or Monthly, and designate green/red trend directionality.
For custom calculations that involve multiple tables or custom Python methods, you can set the Number Card’s Type to Custom. This allows developers to link the card to a whitelisted Python server method:
import frappe
@frappe.whitelist()
def get_net_cash_runway(company):
# Calculate total bank balance
bank_balance = frappe.db.sql(”’
SELECT SUM(debit – credit) FROM `tabGL Entry`
WHERE company=%s AND account IN (
SELECT name FROM `tabAccount` WHERE account_type=’Bank’
)
”’, (company,))[0][0] or 0
return {“value”: bank_balance, “fieldtype”: “Currency”}
Step 2: Creating Dynamic Standard Dashboard Charts
Frappe provides an integrated charting engine (Frappe Charts) that generates SVG-based visualizations without third-party dependencies. To configure a chart from standard document logs:
- Chart Name: Provide a clear operational name, such as Monthly Manufacturing Output by Workstation.
- Chart Type: Choose the visual format best suited to the data:
- Bar Chart: Comparing discrete categories (e.g., Sales by Branch).
- Line Chart: Continuous financial or inventory trends over time.
- Donut / Pie Chart: Proportional breakdowns (e.g., Warehouse Stock Valuation by Category).
- Percentage Bar: Project or budget completion milestones.
- Heatmap: Highlighting activity intensity across calendar days (ideal for production or order intake).
- Timespan & Time Interval: Set the analysis window (e.g., Last 6 Months) and bucket frequency (Weekly or Monthly).
- Color Coding: Standardize your enterprise palette so positive metrics (revenue) use teal/blue and critical indicators (delays, stockouts) appear in amber/red.
Step 3: Engineering Custom SQL & Report-Backed Charts
When business requirements involve complex joins across multiple database tables—such as calculating gross profit margin across invoices while accounting for item-specific landing costs and sales commissions—standard GUI chart builders are insufficient. Frappe allows developers to link a Dashboard Chart directly to a Script Report or custom SQL query.
SELECT
customer_name AS customer,
SUM(CASE WHEN DATEDIFF(CURDATE(), due_date) <= 30 THEN outstanding_amount ELSE 0 END) AS “0-30 Days”,
SUM(CASE WHEN DATEDIFF(CURDATE(), due_date) BETWEEN 31 AND 60 THEN outstanding_amount ELSE 0 END) AS “31-60 Days”,
SUM(CASE WHEN DATEDIFF(CURDATE(), due_date) > 60 THEN outstanding_amount ELSE 0 END) AS “Over 60 Days”
FROM `tabSales Invoice`
WHERE docstatus = 1 AND outstanding_amount > 0
GROUP BY customer_name
ORDER BY “Over 60 Days” DESC
LIMIT 10;
By saving this logic in a Frappe Query Report, administrators can attach a stacked bar chart to the dashboard, giving credit controllers instantaneous visibility into overdue client accounts without running heavy financial statements. For comprehensive financial workflows, explore our dedicated guide to ERPNext in finance.
Step 4: Architecting Role-Based Frappe Workspaces
Workspaces serve as the home screen for users in Frappe v14 and v15. A well-designed workspace combines Number Cards, Dashboard Charts, Shortcuts, and Quick Lists into a cohesive operational workflow:
- Entering Edit Mode: On any workspace, click the Edit button in the top right corner. This activates Frappe’s visual block layout builder.
- Header Cards: Place 3 to 4 high-priority Number Cards in a top row for immediate visual impact.
- Main Analytics Grid: Position two primary charts side-by-side (e.g., Monthly Sales Trends alongside Top Revenue Accounts).
- Operational Shortcuts with Dynamic Badges: Create quick-action buttons that display live document counts (e.g., Pending Delivery Notes with a badge displaying the exact count of unfulfilled orders).
- Role-Based Access Control (RBAC): Under Workspace Settings, restrict visibility by User Role. A store cashier must not see corporate profitability cards, while senior management should see consolidated multi-company summaries.
Step 5: Dynamic Client Scripting & Session Filters
In multi-company or multi-branch enterprises, dashboards must adapt dynamically to the logged-in user’s organizational context. Using Frappe Client Scripts, developers can pass runtime session filters (such as frappe.defaults.get_user_default("company") or assigned branch warehouses) directly into dashboard queries. Discover how customized software solutions allow growing enterprises to build complex custom logic on open-source frameworks.
Production-Grade Role-Based Dashboard Blueprints
To accelerate your implementation, here are four production-proven dashboard architectures developed by Invento Software Limited for enterprise deployments in Bangladesh:
1. Executive & CFO Financial Command Dashboard
Key Visualization Stack:
- Top Row (Number Cards): Net Cash & Bank Balances (BDT) | Month-to-Date Revenue | Total Overdue Receivables | Current NBR Output VAT Liability (Mushak 6.3).
- Chart 1 (Dual-Axis Line Chart): 12-Month Operating Revenue vs. Operating Expenses with Profit Margin % overlay.
- Chart 2 (Bar Chart): Accounts Receivable Aging Breakdown (Current, 30 Days, 60 Days, 90+ Days).
- Chart 3 (Donut Chart): Operating Expenditure Allocation (Payroll, Rent, Utilities, Raw Material Purchases).
- Quick List: Invoices Awaiting Executive Credit Limit Approval.
This layout provides the CFO with immediate visibility into liquidity, tax obligations, and credit risk without waiting for month-end reconciliation. To align with national tax mandates, read our guide on Bangladesh VAT compliance and management.
2. Supply Chain & Multi-Warehouse Operations Dashboard
Key Visualization Stack:
- Top Row (Number Cards): Critical Stockout Alert Count | Pending Purchase Receipts (GRN) | Active Material Requests | Expiring Lots (<30 Days).
- Chart 1 (Bar Chart): Inventory Valuation by Regional Depot / Warehouse.
- Chart 2 (Line Chart): Daily Dispatch Volume vs. Inbound Stock Receipts.
- Quick Shortcuts: Stock Entry (Material Transfer Challan) | Purchase Receipt Quality Inspection | Delivery Note Dispatch.
This command center prevents unfulfilled sales orders and minimizes stock shrinkage. For multi-depot strategies, see our analysis of the role of ERP in supply chain management, ERPNext for distribution companies, and our guide on import/export Letter of Credit (LC) management.
3. Multi-Store Retail & POS Performance Dashboard
Key Visualization Stack:
- Top Row (Number Cards): Total Network Sales Today (BDT) | Total Customer Footfall / Bill Count | Average Basket Value | Open Cashier Registers.
- Chart 1 (Horizontal Bar Chart): Top 10 Best-Selling SKUs Across All Outlets.
- Chart 2 (Multi-Bar Chart): Hourly Sales Distribution by Branch (identifying peak footfall hours).
- Quick List: Cashier Shift Closing Discrepancies (Over/Short alerts).
Retail executives can track store performance across nationwide branches in real time. Dive into our master manual on ERPNext multi-store retail management and explore the Invento POS software platform.
4. Manufacturing Shop-Floor & Production Dashboard
Key Visualization Stack:
- Top Row (Number Cards): Active Work Orders | Today’s Production Yield (Units) | Quality Rejection Rate % | Machine Downtime Hours.
- Chart 1 (Stacked Bar Chart): Planned vs. Actual Production by Workstation / Production Line.
- Chart 2 (Heatmap): Machine Scrap & Waste Generation by Shift.
- Quick Shortcuts: Job Card Logging | Raw Material Indent | Quality Inspection Verification.
Factory plant managers maintain complete control over line efficiency and raw material consumption. Read our complete guide to manufacturing ERP systems and review how to automate payroll for factory labor with our guide to ERPNext HR & Payroll modules and our review of the best HR & payroll software in Bangladesh.
Automated KPI Telemetry: Push Alerts via Email, SMS & WhatsApp
While visual dashboards are essential for active monitoring, high-priority operational exceptions should proactively alert stakeholders. In ERPNext, administrators can tie Notification DocTypes and Frappe Server Hooks directly to dashboard KPI thresholds:
- Cash Flow Minimum Threshold Alert: Trigger an urgent SMS or WhatsApp notification to the CFO if the primary operational bank balance falls below BDT 5,00,000.
- Factory Scrap Spike Warning: Dispatch an instant email alert to the Plant Director if a Work Order’s scrap percentage exceeds 4.5% of theoretical BOM input.
- Scheduled Executive Daily Digest: Utilize Frappe’s built-in Auto Email Reports to deliver high-resolution PDF or HTML snapshots of the CFO Dashboard to board members every evening at 8:00 PM. Learn about future intelligence features in our analysis of the future of ERP in 2026 and emerging ERP business trends.
Enterprise Performance & Database Optimization Best Practices
A poorly configured dashboard that runs unindexed table scans against millions of historical ledger records can degrade overall ERP performance during peak business hours. To maintain blazing dashboard speeds, follow these engineering standards:
- 1. Database Indexing on Custom Filter Fields: When filtering Number Cards or Charts by custom DocType fields (e.g.,
custom_branch_codeorcustom_delivery_status), ensure that a database index is explicitly created on those columns in MariaDB or PostgreSQL. - 2. Configure Cache Refresh Intervals: By default, charts should not run real-time queries on every page reload. In the
Dashboard Chartsettings, configure the Auto Refresh interval to 15 or 30 minutes for executive trends. Only operational frontline cards (such as POS cash counts) require immediate real-time execution. - 3. Filter by Indexed Date Columns: Always filter historical queries using primary indexed date fields (e.g.,
posting_date,creation) rather than calculated expressions or sub-queries. - 4. Offload Historical Big Data to Read Replicas: When an enterprise reaches hundreds of thousands of transactions per month, connect heavy analytical dashboards to a read-replica database instance to ensure zero disruption to frontline cashier checkout and warehouse barcode scanners. Read our evaluation of why cloud ERP software is essential for modern business scaling and discover why top software companies in Bangladesh adhere to strict database performance benchmarks.
Dashboard Governance & Preventing Metric Drift
As organizations expand, individual department heads frequently request new charts and custom metrics. Without strict dashboard governance, systems suffer from “metric drift”—where different managers define identical terms differently (for example, Sales calculating gross revenue before returns while Finance calculates net invoiced amount). To prevent organizational confusion:
- Designate a Single Data Steward: Empower a central ERP administrator or systems analyst to approve new public Number Cards and Charts.
- Maintain a Unified Metric Dictionary: Clearly document the exact SQL definition and business rules for every corporate KPI.
- Quarterly Workspace Pruning: Review user engagement metrics quarterly and deprecate unused cards and charts to keep workspace screens clean and fast.
Frequently Asked Questions (FAQ)
Can I customize ERPNext dashboards without writing code?
Yes. Non-technical administrators can build standard Number Cards, Bar Charts, Line Graphs, and custom Workspace layouts directly through the Frappe GUI builder without writing any code. Custom coding (SQL or Python Script Reports) is only required when performing complex multi-table calculations or specialized mathematical formulas.
How do I restrict dashboard visibility based on user roles and permissions?
Frappe uses Role-Based Access Control (RBAC). In the Workspace settings, you can assign specific Roles (e.g., Accounts Manager, Stock User, Sales Master) to individual workspaces, cards, and shortcuts. Users only see metrics and quick-action buttons for DocTypes they are permitted to view under Frappe Role Permission Manager.
Are custom ERPNext dashboards responsive on mobile devices?
Yes. Frappe’s Workspace grid and charting components are natively responsive. Number Cards and charts automatically stack vertically on smartphone and tablet screens, allowing managers and traveling executives to monitor business metrics on the go.
Will custom dashboard modifications survive Frappe Framework version upgrades?
Yes, provided best practices are followed. When dashboards, number cards, and workspaces are created through custom Frappe apps or exported to your custom site repository, they remain completely insulated from core framework updates across versions 14, 15, and 16.
Can external BI platforms like Power BI or Metabase be embedded into ERPNext?
Yes. You can embed interactive dashboards from Metabase, Apache Superset, or Microsoft Power BI directly into ERPNext workspaces using custom HTML blocks and signed iframe embedding tokens, combining ERP operations with deep analytical modeling.
Next Step: Partner with Certified ERPNext Engineers
Turn Your Business Data Into Real-Time Strategic Clarity
Stop wasting valuable executive hours compiling fragmented spreadsheets. Partner with Invento Software Limited—the official certified ERPNext partner in Bangladesh—to design high-impact, role-based dashboards engineered for your operational success.